Functions and graphs
function given by a table
To draw the graph of a function given by a table, we have to represent the x column in the horizontal axis and the y or f(x) column in the vertical axis.
Example:
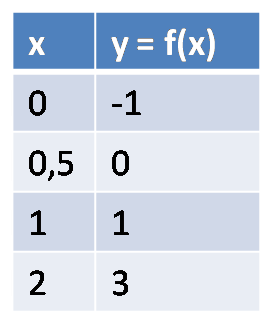
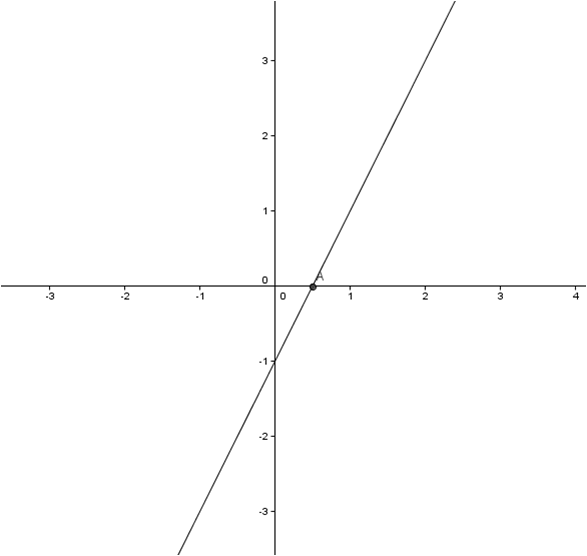
Sometimes we use the table as an intermediate step, when we have the formula.
In the example: y = 2x - 1
Exercise: represent the graph of the function y = x2 + 1 (a parabola), by completing this table:
| x | y |
| -2 | |
| -1 | 2 |
| 0 | 1 |
| 1 | |
| 2 | 5 |
Solution:

Licensed under the Creative Commons Attribution Non-commercial Share Alike 3.0 License