STATISTICS
bar chart
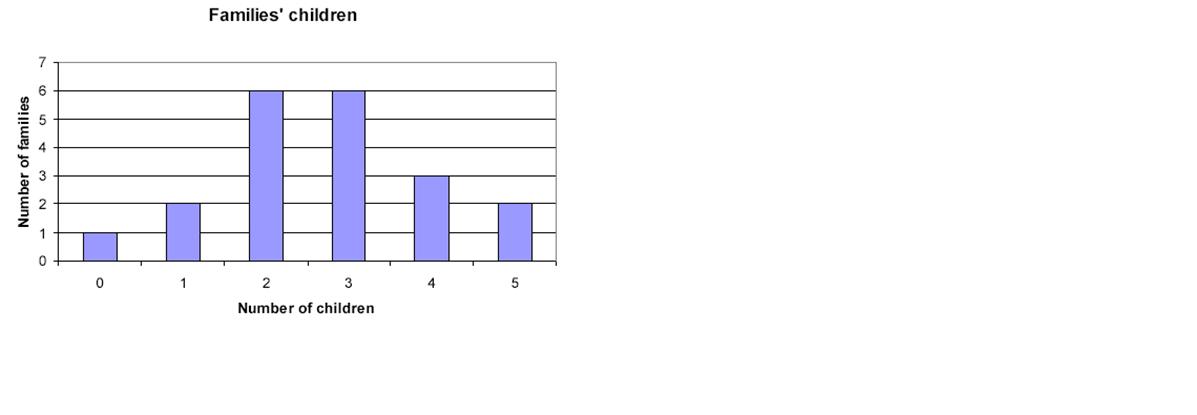
BAR CHART: It is recommended for discrete quantitative variables.
Example: 20 families were asked how many children they had:
| xi | fi |
| 0 |
1 |
| 1 | 2 |
| 2 | 6 |
| 3 | 6 |
| 4 | 3 |
| 5 | 2 |
Licensed under the Creative Commons Attribution Non-commercial No Derivatives 3.0 License