STATISTICS
pie chart
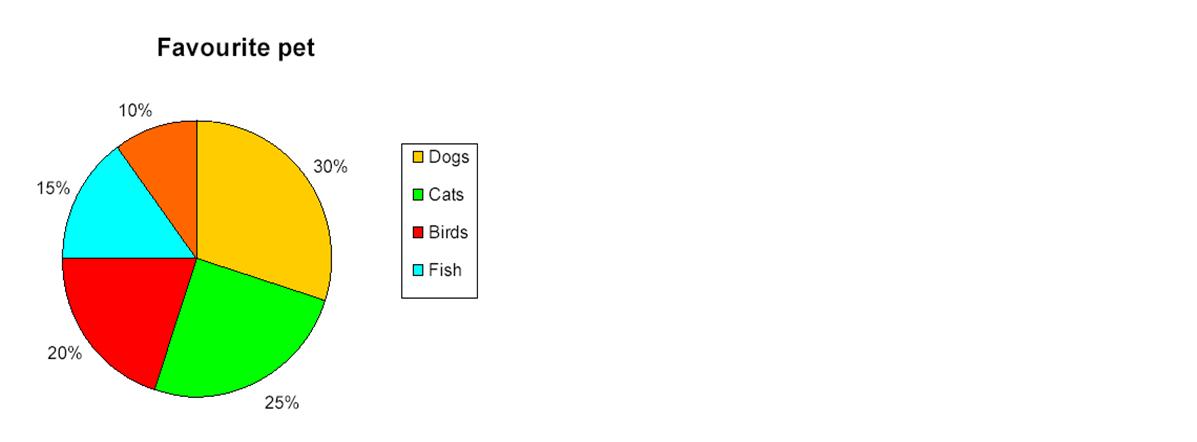
PIE CHART: It is recommended for qualitative variables. The circle angle formula is:
Example: There are 20 students in my class. They were asked about their favourite pet:
| xi |
fi | hi |
% | º |
| Dog | 6 | 3/10 |
30% |
108º |
| Cat | 5 | 1/4 | 25% | 90º |
| Fish | 3 | 3/20 | 15% | 54º |
| Birds | 4 | 1/5 | 20% | 72º |
| Others | 2 | 1/10 | 10% | 36º |
| Σ | 20 | 1 | 100% | 360º |
Licensed under the Creative Commons Attribution Non-commercial No Derivatives 3.0 License